WEEKLY BRIEF

01 / REVENUE MOMENTUM

AI Revenue Tracker

Track the latest disclosed annualized revenue and estimate where each company stands today.

NOWCAST AS OF 23 AUG
A

Anthropic

Revenue run-rate

Current projected ARR

$73.5B

+$8.5B estimated since July month-end

Latest reported ARR

$65.0BJul 31, 2026

Last-month MoM

+17.6%June → July
8-month trajectory$9.0B$65.0B
9
11
14
19
30
47
55
65
DecJanFebMarAprMayJunJul

Reported as >$65bn; tracker uses $65bn lower bound
O

OpenAI

Revenue run-rate

Current projected ARR

$42.9B

+$2.9B estimated since July month-end

Latest reported ARR

$40.0BJul 31, 2026

Last-month MoM

+9.9%June → July
8-month trajectory$20.0B$40.0B
20
22
25
27
30
33
36
40
DecJanFebMarAprMayJunJul

Company internal communication reported by Axios

CURRENT JUDGEMENT

Demand-led tightening

Revenue momentum is accelerating while both legacy and frontier GPU rental indices remain firm.

01 / DEMANDARR still accelerating

Anthropic's latest monthly growth is running ahead of OpenAI's, pointing to broadening model demand rather than a single-company cycle.

02 / PRICINGOld GPUs are not clearing lower

A100 and H100 are both positive year-on-year. Near-term availability is outweighing theoretical efficiency gains.

03 / REGIMEDelivery time is still priced

H100 trades near its one-year high, suggesting the market continues to pay for immediately deployable capacity.

01

How to read this

“Latest reported ARR” is the public anchor. “Current projected ARR” is a simple timing nowcast, not company guidance. It assumes the previous month's growth accrued evenly across the current month.

USD billionsAnnualized run-rateLinear nowcast

02 / GPU RENTAL PRICING

Compute Rental Prices

Track current neo-cloud on-demand rental pricing and where each GPU sits within its one-year range.

SILICON DATA22 AUG 2026
GPU INDEX

A100

$1.65/hr
IMPLIED MATURE ARR$12.3bn / IT GW
30D+0.0%
1Y+17.9%
1Y low $1.341Y high $1.66
GPU INDEX

H100

$2.70/hr
IMPLIED MATURE ARR$12.9bn / IT GW
30D+0.7%
1Y+29.8%
1Y low $1.961Y high $2.80
GPU INDEX

H200

$3.24/hr
IMPLIED MATURE ARR$15.4bn / IT GW
30D+4.9%
1Y+20.0%
1Y low $2.681Y high $3.31
GPU INDEX

B200

$5.65/hr
IMPLIED MATURE ARR$22.4bn / IT GW
30D+0.5%
1Y+8.2%
1Y low $4.291Y high $6.11
READ-THROUGH

H100 is up 29.8% year-on-year and trades close to its one-year high; H200 has the strongest 30-day move. Older Hopper capacity is not clearing like a rapidly depreciating commodity.

MODEL ASSUMPTIONS80% utilization · 85% of spot realized in LTA
GPU TDP → FULL-SYSTEM POWERA100 400W → 800W · H100/H200 700W → 1,250W · B200 1,000W → 1,500W
NEBIUS 2Q26 DEAL ANCHOR$20–25bn ACV / MW-normalized GW

Nebius reported Q2 deals above $20m ACV/MW, with four landmark deals at $20–25m/MW. Early-Q3 short-term capacity reached a $40–50m/MW pricing opportunity. These are new-deal economics, not current company ARR divided by total power.

Source: Silicon Data. Limited summary of standard GPU indices viewed on Aug 23, 2026; index observations are as of Aug 22, 2026. B300 is omitted because no standalone Silicon Data index was available.

03 / COMPUTE SUPPLY

AI Data Center Buildout

Track operational IT capacity, future development pipeline and the pace at which planned supply is becoming usable compute across major U.S. data centers.

EPOCH AI · MODEL SNAPSHOT2Q26 ACTUAL / THROUGH 4Q27 MODEL
2Q26 OPERATIONAL IT11.55GW

Epoch-tracked operating capacity

2Q26 FUTURE PIPELINE23.24GW

Tracked construction and future development pipeline

3Q26E OPERATIONAL IT13.05GW

Expected operating capacity

3Q26E NEWLY OPERATIONAL1.50GW

Expected q/q capacity addition

CAPACITY CONVERSIONTotal tracked capacity, stacked by status
25.3
23.0
2.3
1Q25
28.2
24.8
3.5
2Q25
30.5
26.3
4.2
3Q25
33.9
27.6
6.3
4Q25
34.8
27.2
7.6
1Q26
34.8
23.2
11.6
2Q26
34.8
21.7
13.1
3Q26
34.8
19.2
15.6
4Q26
34.8
17.4
17.4
1Q27
34.8
16.8
18.0
2Q27
34.8
15.3
19.5
3Q27
34.8
13.0
21.8
4Q27
Operational IT GWFuture pipeline GW
WHO IS LIVEOperational IT capacity by provider · 2Q26
22.5%
16.8%
13.2%
13.0%
11.3%
13.9%
GCP2.60GW22.5%
Meta1.94GW16.8%
Azure1.52GW13.2%
AWS1.50GW13.0%
SpaceXAI1.30GW11.3%
CoreWeave0.55GW4.8%
Oracle0.49GW4.2%
Nebius0.05GW0.4%
Other tracked providers1.60GW13.9%

Source: Epoch AI satellite imagery tracking. SpaceXAI is anchored to an SEC-reported 1.0GW nameplate compute draw at 1Q26, then extended with Epoch's modeled Colossus II staging. Meta's 1.94GW is more model-dependent: company disclosures confirm Prometheus' 1GW target, but not every site-level quarter-end estimate. “Future pipeline” includes tracked future capacity and should not be read as a clean under-construction-only measure. 3Q26–4Q27 are model periods.

05 / COMPUTE CREDIT

Compute Credit Conditions

Track how customer credit support, collateral structure and refinancing conditions translate into neo-cloud funding costs.

CCIRAS OF 18 AUG 2026
COREWEAVE FACILITYDDTL 5.5

GPU / contract-backed term financing

FACILITY SIZE$2.6B

CCIR tracked amount

PRICINGSOFR +550bp

Floating-rate funding cost

CONTRACT SUPPORTUnrated

Take-or-pay customers

COREWEAVE DDTL 5.5Facility snapshot
DDTL 5.5Unrated take-or-pay customers
+5.50%$2.6B

Spread over SOFR. These facilities are not identical; the comparison is a directional read on how contract quality changes marginal funding cost.

Q3 2026 QTD ISSUANCE$23.3B tracked
$6.1B
$16.6B
GPU collateral$6.1B26.2%
Operator campus$0.6B2.6%
Landlord SPV / securitization$16.6B71.2%
WHAT IT SHOWS

DDTL 5.5 provides a current marginal funding-cost anchor for projects backed by unrated take-or-pay customer contracts: SOFR plus 550bp before fees and other structural costs.

Source: CCIR Compute Credit Tracker and Credit Reference Series; selected quoted values as of 18 Aug 2026. Full time series and ledger are not reproduced.

04 / MODEL USAGE

OpenRouter Demand

Weekly token traffic shows where inference demand is actually routing across models and providers.

OPENROUTERTHROUGH 22 AUG
PAID OPEN-WEIGHT TOKENS41.4T

Selected paid models; free variants excluded

OPEN-WEIGHT WEEKLY REVENUE$3.09m

Theoretical, at modeled blended price

CLOSED-MODEL SAMPLE REVENUE$4.60m

Directional only; direct API traffic excluded

PAID OPEN-WEIGHT MOMENTUM+7.4%

Exact trailing 7-day volume versus prior 7 days

OPEN PRIOR WEEK38.6T
OPEN CURRENT WEEK41.4T
CLOSED SAMPLE10.7%
VALUE SHAREWeekly theoretical revenue by company

Each company's paid models are consolidated in the main bar. Model-level detail remains in the rankings below.

PAID OPEN-WEIGHT — INTERNAL SHARE$3.09m
GLM / Z.ai34.6% shareKimi30.0% shareDeepSeek16.6% shareTencent13.2% shareXiaomi5.6% share
GLM / Z.ai$1.07m · 34.6%
Kimi$0.93m · 30.0%
DeepSeek$0.51m · 16.6%
Tencent$0.41m · 13.2%
Xiaomi$0.17m · 5.6%
CLOSED SAMPLE — INTERNAL SHARE$4.60m
Claude64.9% shareOpenAI26.3% shareGoogle8.8% share
Claude$2.99m · 64.9%
OpenAI$1.21m · 26.3%
Google$0.40m · 8.8%
PAID OPEN-WEIGHT MODELS$3.09mtheoretical weekly revenue
MODELWEEKLY TOKENSBLENDED $/MTOKWEEKLY REV.WOW
01DeepSeek V4 Flash 0731DeepSeek
11.64T
$0.024$0.28m+5.3%
02MiMo-V2.5Xiaomi
9.14T
$0.019$0.17m+137.8%
03Hy3Tencent
8.56T
$0.048$0.41m-18.0%
04DeepSeek V4 Flash 0423DeepSeek
5.30T
$0.016$0.08m+11.2%
05GLM 5.2Z.ai
3.59T
$0.298$1.07m-15.2%
06DeepSeek V4 Pro 0423DeepSeek
1.88T
$0.080$0.15m-32.1%
07Kimi K3Moonshot AI
1.30T
$0.713$0.93m-10.4%
CLOSED MODELS$4.60mtheoretical weekly revenue
MODELWEEKLY TOKENSBLENDED $/MTOKWEEKLY REV.WOW
01GPT-5.6 LunaOpenAI
5.17T
$0.050$0.26m-1.0%
02Claude Opus 5Anthropic
2.09T
$1.188$2.48m+1.1%
03Gemini 3.7 FlashGoogle
1.58T
$0.089$0.14m+543.7%
04Gemini 3.6 FlashGoogle
1.48T
$0.178$0.26m-19.8%
05GPT-5.6 SolOpenAI
1.23T
$0.475$0.58m+75.3%
06Claude Sonnet 5Anthropic
1.07T
$0.475$0.51m-1.2%
07GPT-5.6 TerraOpenAI
0.75T
$0.495$0.37m-17.9%
BLENDED PRICE ASSUMPTION

90% cache hit rate · 10% uncached input · input/output tokens = 100:1. Blended $/MTok = input share × (90% × cached-input price + 10% × input price) + output share × output price. Theoretical weekly revenue = weekly tokens × blended $/MTok.

Source: OpenRouter (openrouter.ai/rankings), Data API as of Aug 23, 2026; usage windows Aug 9–15 and Aug 16–22. Licensed under CC BY 4.0. Free variants, NVIDIA Nemotron and unidentified free models are excluded. Open-weight and closed-model value shares are normalized only within their own samples and must not be compared with each other; closed-model direct API traffic is not captured.

06 / WEEKLY INTELLIGENCE

What Mattered This Week

WEEK ENDING23 AUG 2026
PRICING

NVIDIA server prices reportedly set to rise more than 15%

Memory inflation is pushing up systems based on Vera Rubin and Grace Blackwell, with increases expected on early-2027 shipments.

INVESTMENT READ-THROUGH

The direct read-through is higher system procurement cost. The effect on neo-cloud project returns depends on contract pricing and the operator's ability to pass those costs through.

Bloomberg via FortuneREAD SOURCE ↗
SUPPLY

Nebius and Vantage commit capacity in South Wales

Nebius will lease NVIDIA-powered high-density capacity at Vantage's Newport campus in the UK's South Wales AI Growth Zone.

INVESTMENT READ-THROUGH

Positive for Nebius delivery capacity, but the revenue timing still depends on fit-out, GPU deployment and customer activation.

ITPro / VantageREAD SOURCE ↗
DEMAND

OpenAI extends Zero Data Retention to frontier models

Eligible API customers can use frontier models without OpenAI retaining prompts or responses after processing.

INVESTMENT READ-THROUGH

Reduces a major blocker for regulated enterprise workloads and can expand high-value inference demand. In comparison, Anthropic supports ZDR for Opus 5 but not Fable 5; mandatory retention may help detect or deter model-distillation attempts against Fable 5.

OpenAIREAD SOURCE ↗
MODEL

OpenAI slows frontier scaling and pauses its largest planned RL run

OpenAI cited critical cyber-capability risks and higher security requirements; monitoring overhead is estimated at roughly 20% of affected inference compute.

INVESTMENT READ-THROUGH

Near-term launch timing risk rises, while security monitoring itself adds compute demand and raises the cost of frontier development.

OpenAIREAD SOURCE ↗
MODEL

Z.ai's current view on training: scaling has more than one dial

Z.ai's current view is that parameter count is not the only training variable worth scaling. GLM-5.3 kept the same base architecture, total parameters and activated parameters as GLM-5.2, then improved capability by spending one month scaling long-horizon environments and reinforcement learning. The company sees the largest current marginal opportunity in post-training, while pre-training, mid-training, model size and compute per forward pass remain future scaling directions.

INVESTMENT READ-THROUGH

Z.ai believes the largest marginal opportunity for model improvement now lies in post-training. A smaller model can therefore approach the capability of a much larger peer without matching its training or serving cost; compute spending may shift toward long-horizon environments and reinforcement learning rather than parameter scaling alone.

Jie Tang / Z.ai on XREAD SOURCE ↗

Sources: official company disclosures and filings first; specialist datasets and major financial media are used for confirmation.

07 / NEW MODEL WATCH

Recent Model Releases

A rolling two-week comparison of official evaluations, outside reaction and the investment implication behind each launch.

RELEASE WINDOW10–23 AUG 2026
ARTIFICIAL ANALYSISIntelligence Index — frontier comparison

Artificial Analysis v4.1.1 aggregates nine reasoning, knowledge, coding and agentic evaluations. GLM-5.3 now scores 60, level with Kimi K3 and one point behind Grok 4.6.

01Claude Opus 5 (max)
63
02Claude Fable 5
62
03GPT-5.6 Sol (max)
61
04Grok 4.6 (high)
61
05Kimi K3 (max)
60
06GLM-5.3 (max)
60
07Qwen3.8 2.4T
58
08Muse Spark 1.2
57
09GPT-5.6 Terra
57
10Gemini 3.7 Flash
56
11DeepSeek V4 Pro
53
12GPT-5.6 Luna
52
13Muse Glimmer
35
Source: Artificial Analysis Intelligence Index v4.1.1, screenshot supplied 23 Aug 2026. Selected models shown; higher is better.
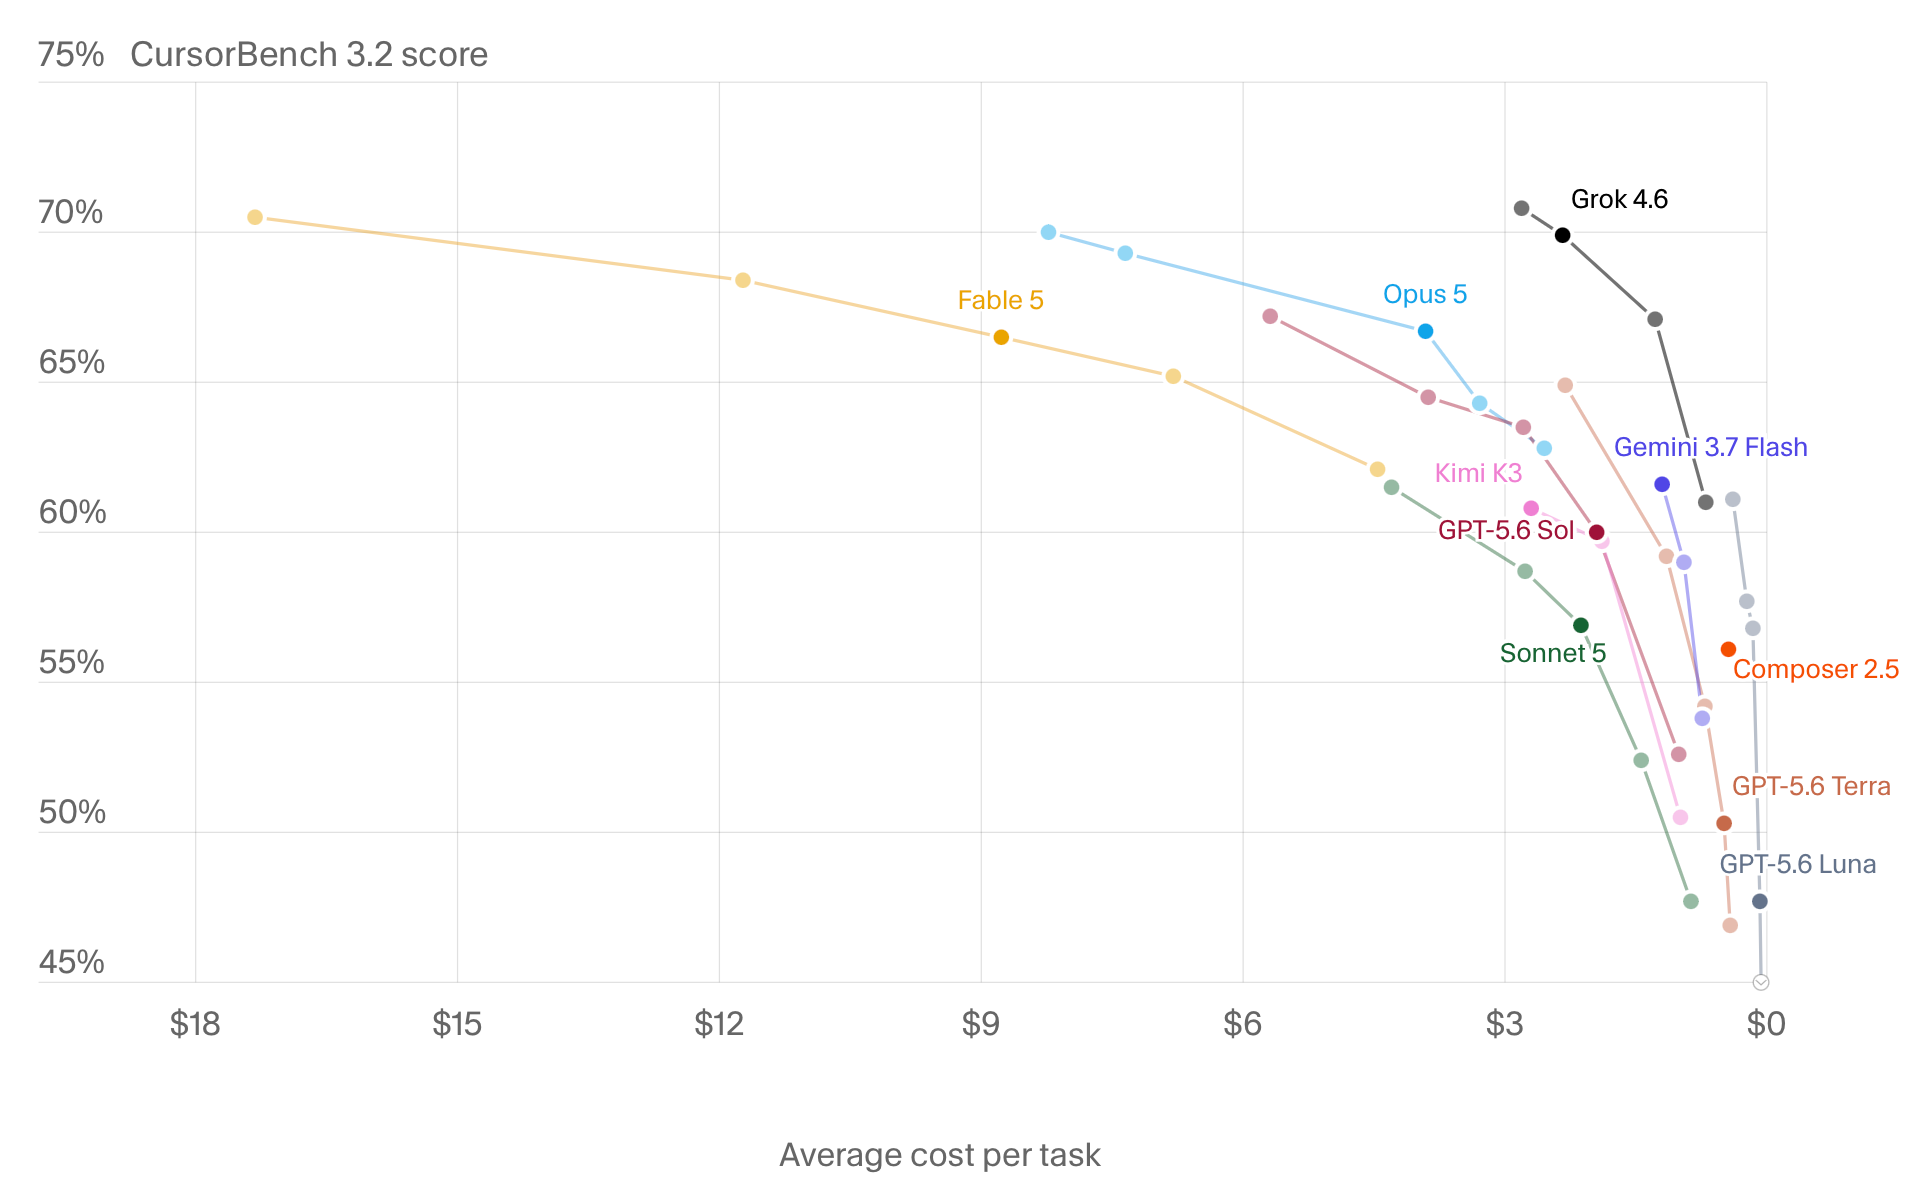
CURSORBENCH 3.2Coding-agent quality versus average task cost

Higher is better; the x-axis runs from expensive on the left to cheaper on the right. Each connected point represents a different reasoning-effort setting for the same model.

CursorBench 3.2 score plotted against average cost per task for leading AI coding models
Source: CursorBench 3.2, accessed 23 Aug 2026. Scores should only be compared within the same benchmark version.
OPEN WEIGHTS · CODING / CYBER

GLM-5.3

Z.ai

ARTIFICIAL ANALYSIS60Intelligence Index
CURSORBENCH 3.2Not testedNo published result
AVG. COST / TASKCursorBench weighted average
OFFICIAL SCORECARDAA Index 60 · CyberGym 84.5% · DeepSWE 66.9%
WHAT THE LAB SAYS

Z.ai reports a 50% improvement over GLM-5.2 on its internal coding benchmark and open-model SOTA on several public agent benchmarks.

OUTSIDE / DEVELOPER VIEW

Independent Chinese testing finds GLM-5.3 close to Kimi K3 in coding, but not above it overall. GLM-5.3 uses materially fewer steps and costs only one-third to one-half as much per task as K3 or Qwen3.8; the trade-off is weaker edge knowledge and less self-testing.

SHORT TAKE

能力接近但实测没有超过Kimi K3;考虑到模型参数更小、单任务成本更低,GLM-5.3的经济性更好。

CODING AGENT

总体接近Kimi K3;开发步骤更少、并发工具调用更积极,同任务成本约为K3或Qwen3.8的1/3–1/2。

WHERE IT LAGS

审美、边缘知识和上下文召回弱于K3;自测偏少,偶发忽略原始要求造成的功能遗漏比交互细节问题更严重。

EFFICIENCY

通用推理输出量较前代上涨约24%,已进入偏低效区间;但在Agent任务中规划较克制,max档全程使用仍具实用性。

ARTIFICIAL ANALYSISFrontier intelligence versus cost per task

GLM-5.3 sits close to Kimi K3 on intelligence while costing less per task. It does not exceed K3 on the independent score, but it occupies the more attractive cost position.

Source: Artificial Analysis Intelligence Index; chart redrawn from the user-supplied snapshot. Positions are illustrative reproductions of the displayed values.
TRACKER JUDGEMENT

Capability is close to Kimi K3 but does not exceed it in independent testing. Because GLM-5.3 reaches that level with a smaller model and much lower task cost, its economic position is stronger than the raw score alone suggests.

CLOSED · FAST INFERENCE / CODING

Gemini 3.7 Flash

Google

ARTIFICIAL ANALYSIS56Intelligence Index
CURSORBENCH 3.260.8%High effort
AVG. COST / TASK$1.20CursorBench weighted average
OFFICIAL SCORECARDAA Index 56 · CursorBench 60.8% · nearly 200 output tok/s
WHAT THE LAB SAYS

Google positions Flash as its high-throughput, low-latency model tier. Gemini 3.7 pairs stronger reasoning and agent performance with service speed approaching 200 output tokens per second.

OUTSIDE / DEVELOPER VIEW

Independent Chinese testing finds a large jump from Gemini 3.5 Flash: coding reaches the high-usable tier, instruction following improves without sacrificing initiative, and the Low setting nearly doubles reasoning performance with only a modest token increase.

SHORT TAKE

Gemini重新回到北美头部模型序列,3.7 Flash是这一轮最明确的翻身之作。

CODING AGENT

较3.5 Flash大幅跃升至高可用水平;既保留主动补充交互、UI和常见功能的能力,也显著改善了指令遵循。主要短板是大型存量工程探索不足,偶尔忽视向前兼容。

EFFICIENCY

Low档平均思维Token约从3.5 Minimal的6K增至10K,但推理性能接近翻倍;High档平均约26K,明显低于同级Qwen3.8-Max和DeepSeek V4 Pro。

SERVICE EDGE

接近200 tok/s的输出速度在相同性能区间缺少对手。速度、较低任务成本与高可用Agent能力的组合,比单项榜单排名更具商业意义。

TRACKER JUDGEMENT

Gemini 3.7 Flash is the family's comeback release. It does not lead the frontier on raw intelligence, but its combination of speed, low reasoning cost and now-credible agent performance makes it one of the strongest commercial inference products.

CLOSED · AGENTS / CODING

Grok 4.6

SpaceXAI

ARTIFICIAL ANALYSIS61Intelligence Index
CURSORBENCH 3.269.9%High effort
AVG. COST / TASK$2.34CursorBench weighted average
OFFICIAL SCORECARDAA Index 61 · CursorBench 69.9% · FrontierCode 61.3%
WHAT THE LAB SAYS

The official evaluation puts Grok level with GPT-5.6 Sol on the Artificial Analysis composite and close to Fable 5 on agentic knowledge work.

OUTSIDE / DEVELOPER VIEW

Independent coverage views the release as a return to the frontier tier, while noting that OpenAI and Anthropic retain a narrow lead on several demanding tasks.

TRACKER JUDGEMENT

A credible frontier alternative, not a decisive leader. The $2 input / $6 output pricing is strategically more important than small benchmark gaps.

OPEN WEIGHTS · LOCAL AGENTS

Muse Glimmer 30B

Meta

ARTIFICIAL ANALYSIS35Intelligence Index
CURSORBENCH 3.2Not testedNo published result
AVG. COST / TASKCursorBench weighted average
OFFICIAL SCORECARDAA Intelligence 35 · 17GB quant · single-device deployment
WHAT THE LAB SAYS

Meta positions the 30B multimodal model as an always-on local agent with reliable tool use, long-horizon workflows and an Apache 2.0 license.

OUTSIDE / DEVELOPER VIEW

Developer tests broadly validate the deployment claim: users report that the official quant fits on 24GB-class hardware and performs especially well in tool calling.

TRACKER JUDGEMENT

Not a frontier-cloud substitute. Its significance is shifting some agent inference to local hardware and lowering the cost floor for private, always-on workflows.

Method: developer benchmarks are not directly comparable unless the harness, reasoning budget and tool scaffold match. Official scores are shown as launch evidence—not treated as independently verified facts. X and community feedback are used to identify real-world strengths or failures, never as the sole performance conclusion.